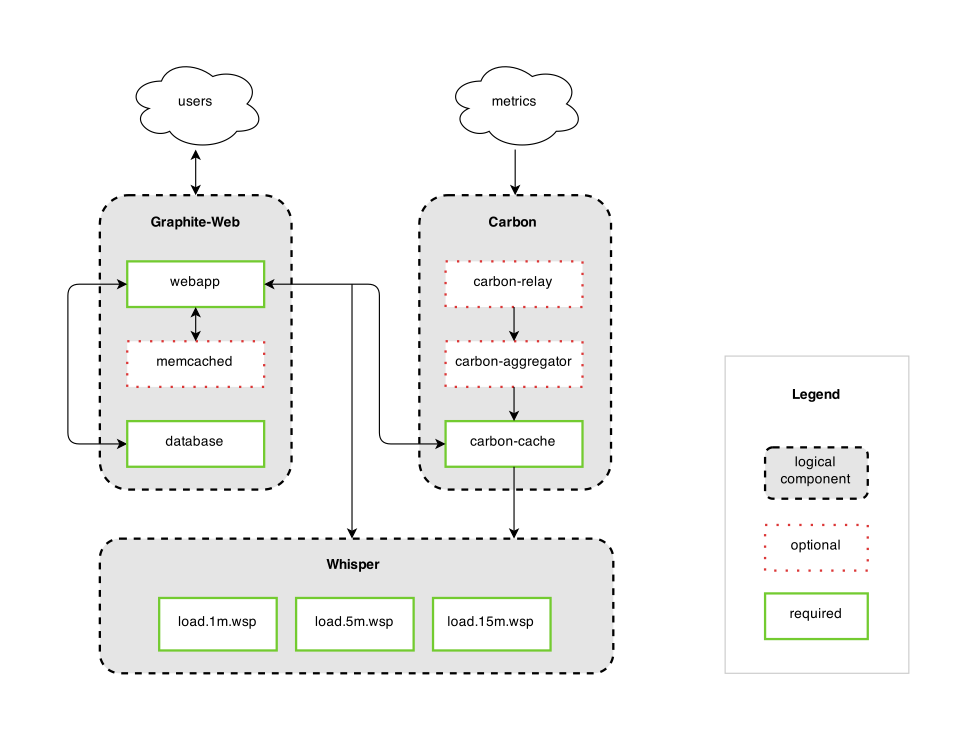
Graphite consists of a storage backend and a web-based visualization frontend. Client applications send streams of numeric time-series data to the Graphite backend (called carbon), where it gets stored in fixed-size database files similar in design to RRD. The web frontend provides 2 distinct user interfaces for visualizing this data in graphs as well as a simple URL-based API for direct graph generation.
Graphite's design is focused on providing simple interfaces (both to users and applications), real-time visualization, high-availability, and enterprise scalability.