pyxplot

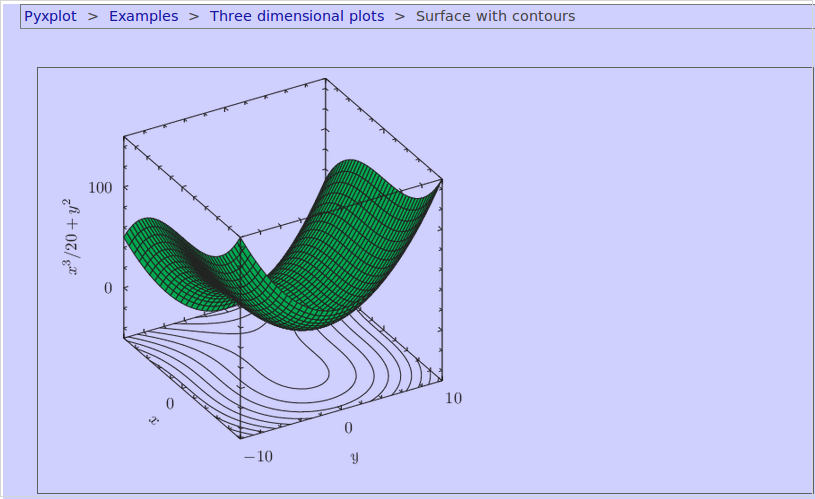
Pyxplot produces publication-quality figures. To this end, text is rendered with all of the beauty and flexibility of the LaTeX typesetting environment.
Extensive documentation and examples can be found in the pyxplot-doc package. A gallery of sample plots is available from the project's web site.