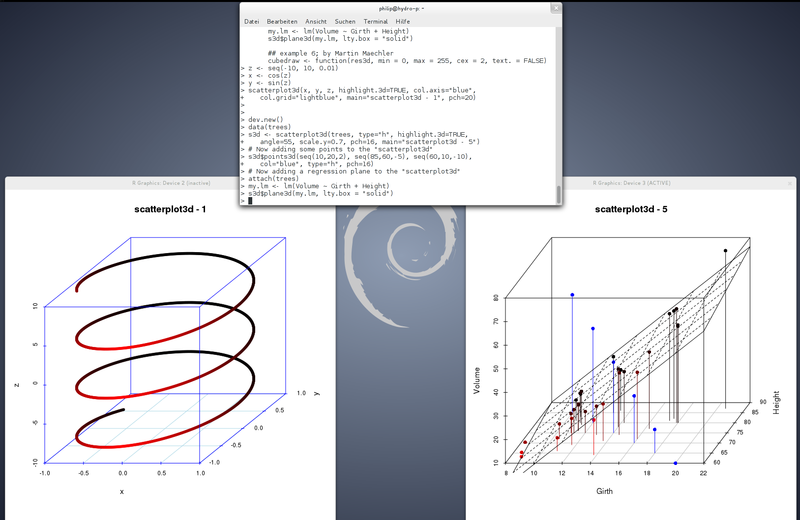
Scatterplot3d is an GNU R package for the visualization of multivariate data in a three dimensional space. Basically scatterplot3d generates a scatter plot in the 3D space using a parallel projection. Higher dimensions (fourth, fifth, etc.) of the data can be visualized to some extent using, e.g. different colors, symbol types or symbol sizes.