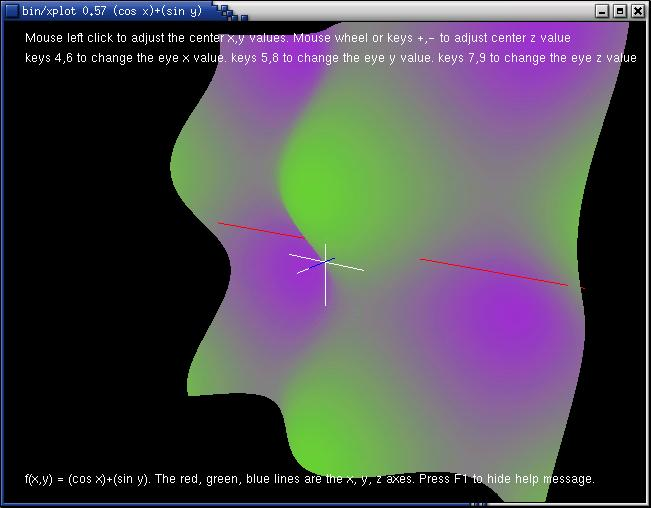
XPlot is a small program to plot one- or two-dimensional datasets, which are present either in a file or are generated `on-the-fly' and piped to XPlot. XPlot lets you display one or more datasets and lets you zoom to different sections of the sets. Also. `blowups' of the currently shown portion of the data can be made.
XPlot is meant for on-screen data exploration. It does not have a print button, nor is it meant for final output or publication-quality figures.

